In 2015, we extented the research of CCTV Chinese New Year Gala from CCTV Gala Opening Three-Minute Redux to a full scale version. We smashed videos from the Gala over the last 33 years from 1983 through 2015 and refactored frames into various timelines, thus revealing how red-dominated the Chinese mass media really is. Or is the Chinese mass media not as red-dominated as we assumed?
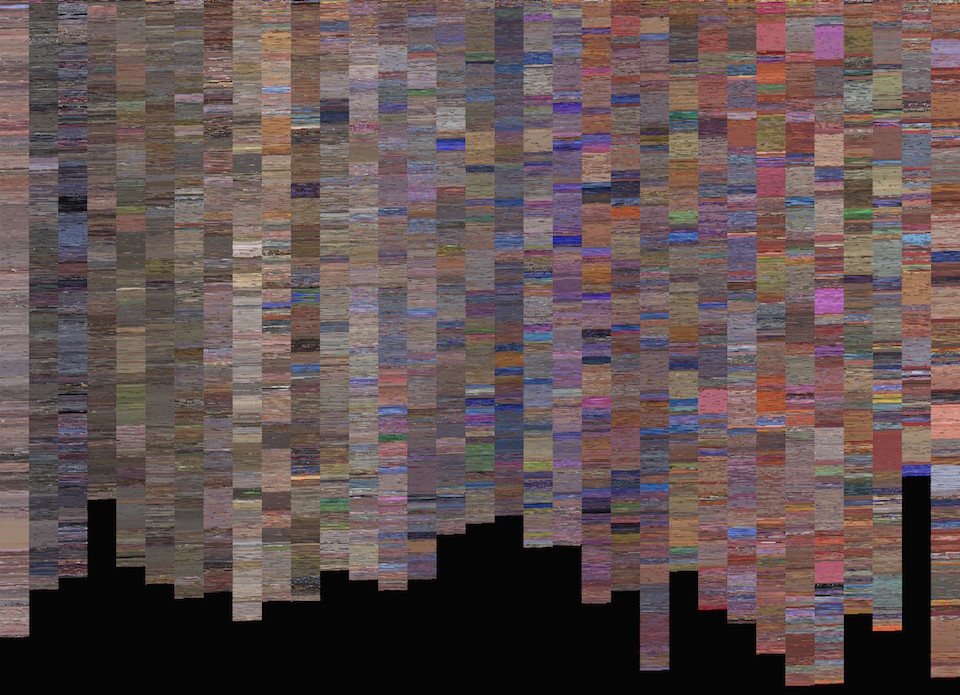
The figure above shows the matrix of 33 years of GALAs. Each frame is one second of the shows, each row has 20 frames so that is 20 seconds. The original resolution was 21,120x15,300, and was reduced to 960x695 for better online experience.In the early years, like 1983/1984, the majority of the colors are grayish, and it is getting more and more colorful due to technology and ideology, users can check out the trend by themselves.
We published a paper on this topic in Chinese Watching Chinese New Year Gala from Neptune through WeChat mobile platform on February 22 2015. An English paper is in plan.
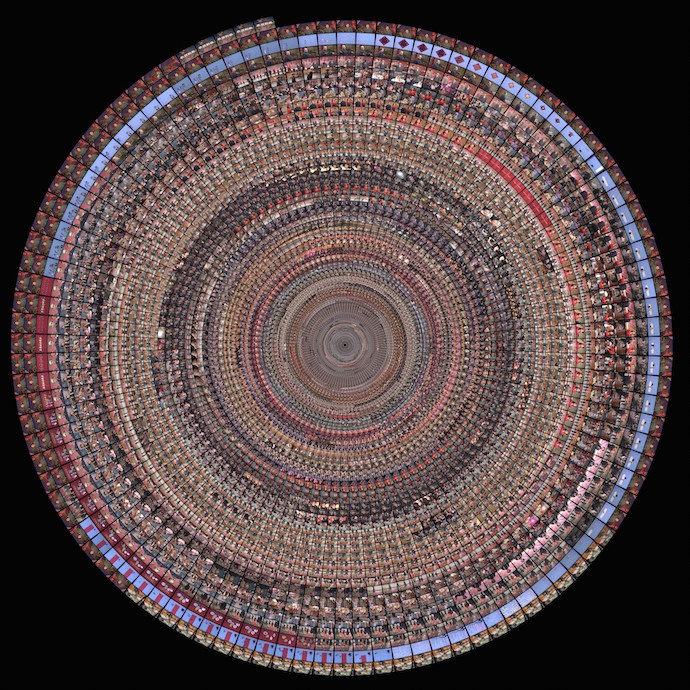
The following slide shows the reframed timeline of each year's Gala, each pie represents one year's show from 1983 to 2015, so one can view one year's Gala in one look.
Some notes:
1. Data was collected from officially published DVDs.
2. We sampled one frame for one second of the real TV program, the outter side of the pie is the earlier time of the show, so the end of the show is in the center.
3. The length of each year's Gala varies from four hours to five and half hours, so that is about 14,400 to close to 20,000 frames per picture.
4. The original resolution of the pictures was 16,000x16,000, we reduced it to 690x690 for easy views online.


