The Flow:
Cases and Places
Updated: 2022-04-19 18:00

Only through comparison, we can decide the major areas of the epidemic; only through the timeline, we can see the trend of the epidemic. Here, each region's number of confirmed 2019 Novel Coronavirus cases defines the size of its circle, all the region circles are tightly contained by the country.
The positions and sizes of all the circles may change hourly. The size of a circle represents the proportion of that region's epidemic; the position of a circle means the rank of that region's epidemic. You can check on a region's name and number by clicking a circle; and you can also backtrace everyday change by dragging the slider.
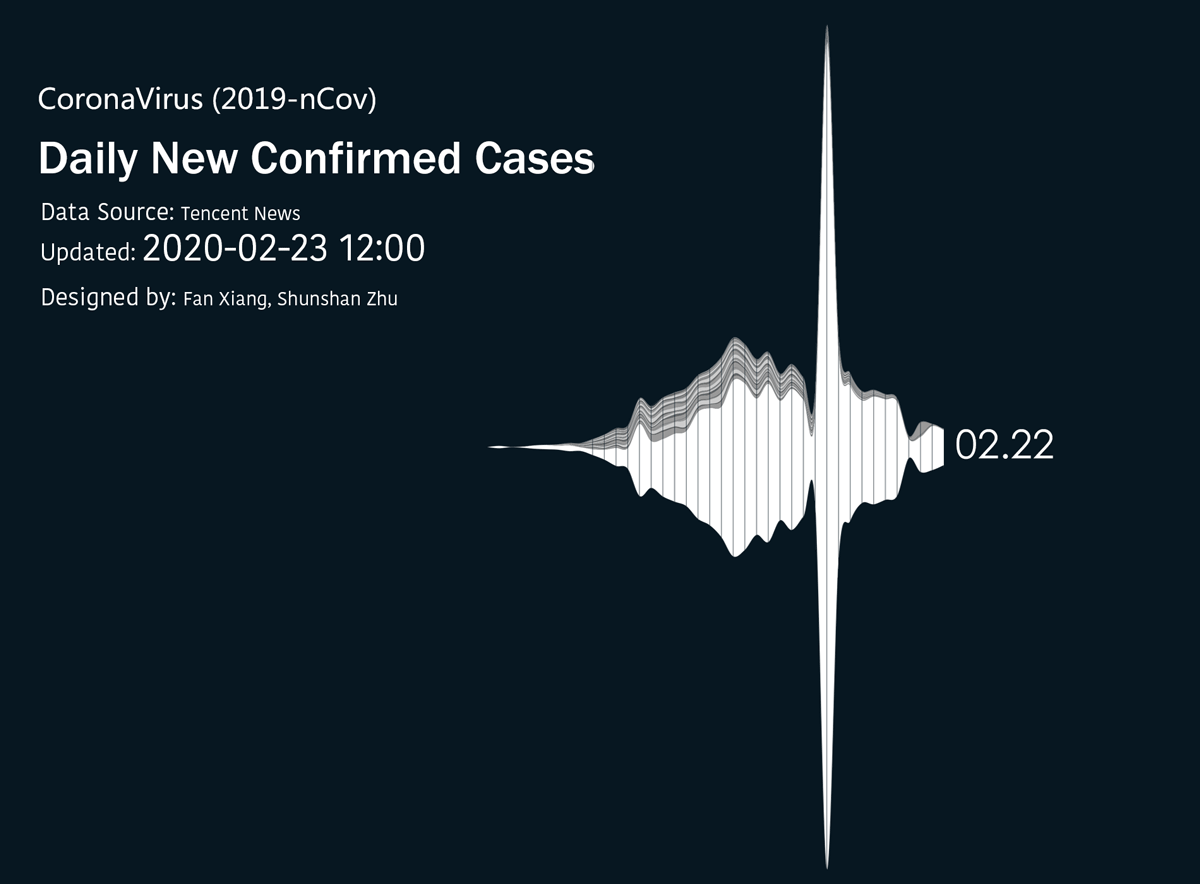
Data Source
Tencent News
Designed by
Fan Xiang, Shunshan Zhu,
Zuocheng Ren, Rui Wang, Hanlu Ma
Contact
shunshan873@yahoo.com
Share
Page Updated:14:23p February 22, 2020

|

|

|