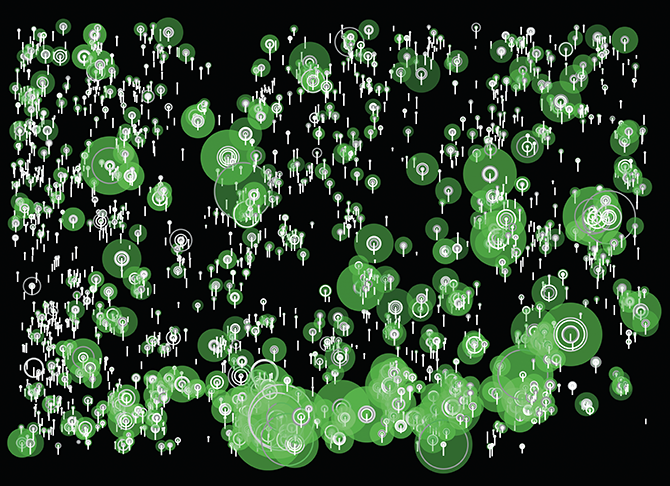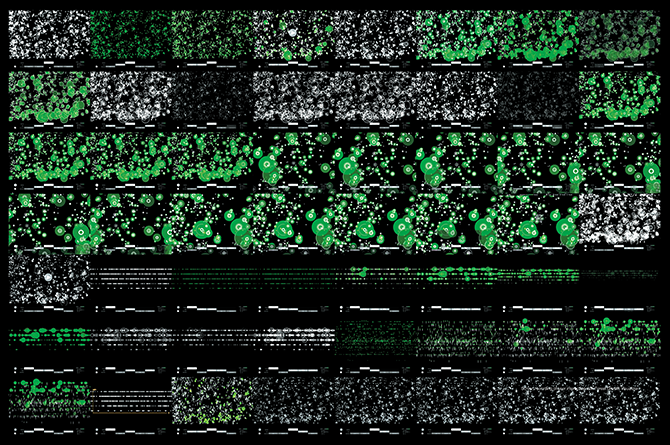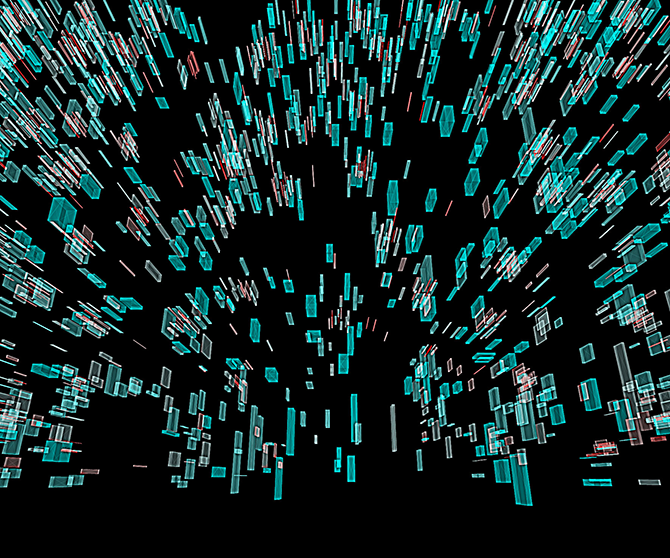
Data visualization can play an active role in the process of scientific analysis and discovery, but the visualization design work cannot be accomplished by scientists or designers alone, it has to be done through collaborations between scientists and designers.
The scientific visualization process has its own sets of challenges, not only because of the size and complexity of the dataset but also because of the specialized knowledge of the subject matter. This requires designers fully understand the scienticifc data in order to create a thoroughly understandable interface and an explorable space.


I, and scientist Shirley Xiaobi Dong from Harvard Univiersity, present an approach to support designing a scientific visualization. Our approach takes into account studies of visual representation, navigation and interaction. We have deployed a method of visualization design that enables designers to develop visualization tools for scientific discoveries. The usability of the tools was tested by scientist through a demonstration.

Data source: collected from Tropic forests in Thailand.
